Position fixing from stars using Marcq Saint Hilaire’s “intercept” method
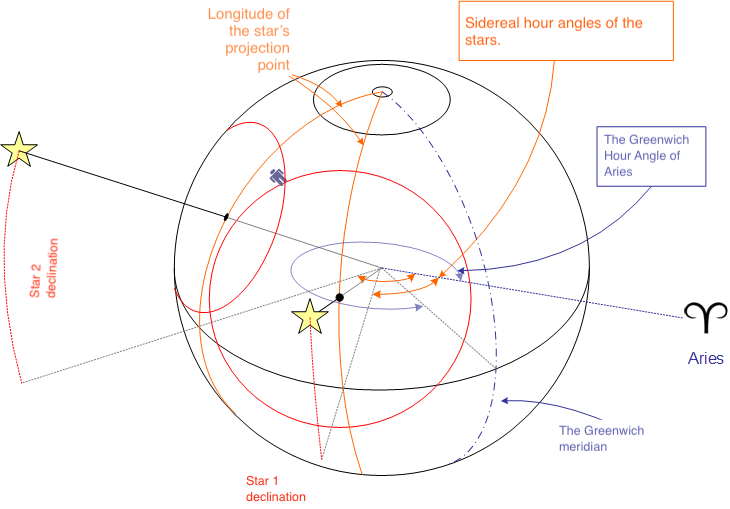
Look at the image below. It shows two stars whose altitudes you can measure, allowing you to determine your distance from the star’s projection point. You have an accurate clock, a chronometer, showing Greenwich time. From the Nautical Almanac you can find the declination (dec) and sidereal hour angle (SHA) of these two stars. You can also find the Greenwich Hour Angle (GHA) of Aries. From this, you can calculate the Greenwich Hour Angle (GHA) of both stars. When you know the declination and the Greenwich Hour Angle of a star, you can determine its subpoint on Earth. From the altitude measurement you obtained the radius of the position circle, which is 90° minus the star’s altitude above the horizon. The radius of the position circle in degrees multiplied by 60 gives its radius in nautical miles.
Now you only need to draw two large position circles on the chart, centered at the stars’ subpoints.
Here is the problem: nautical charts usually cover only a very small part of the Earth. In practice, the method described above does not work directly. Some adjustments are needed.
We need a way to only draw a portion of the position circles — the part that falls on your chart.
As shown in the image above, the circles are large. If a star is only 10° from your zenith, the distance to its subpoint is 600 nautical miles. Such a star is almost directly overhead and its altitude is difficult to measure accurately. If a star is at 50° altitude, the distance to its subpoint is (90° − 50°) × 60 = 2400 nautical miles. If your chart edge is, for example, 100 nautical miles, the visible segment of the position circle is essentially a straight line. Its curvature at that distance is negligible.
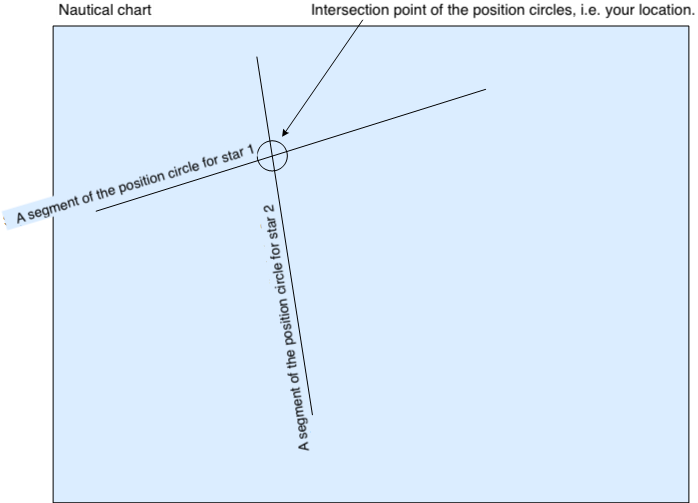
Therefore, we draw two lines that represent segments of the position circles of the stars above.
Good idea, isn’t it.
But how do you draw the correct arc of the circle in the right place? If we can find even one point on the position circle, we can draw the arc through that point.
Marcq Saint Hilaire solved this problem as follows:
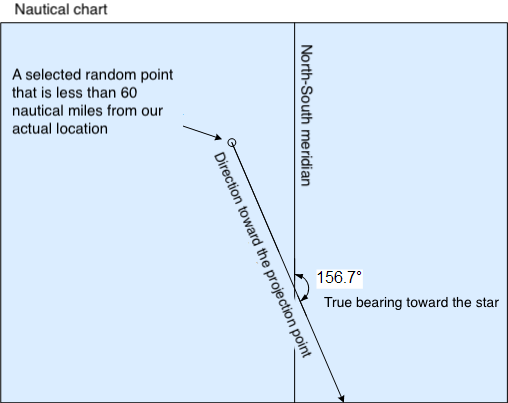
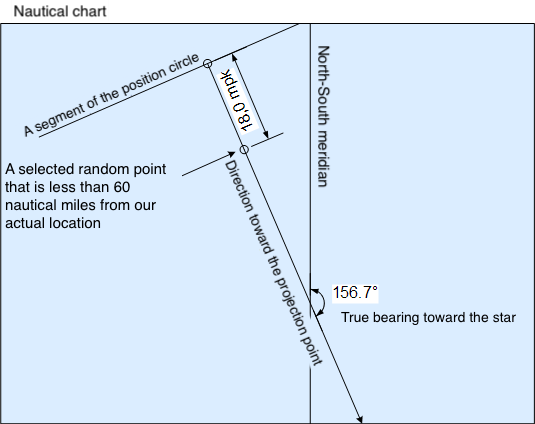
- Choose a point P that is within 60 nautical miles of your true position. It does not need to be more accurate than that.
- Calculate the direction of the star’s subpoint from point P. This means solving the nautical triangle assuming that point P is your position. Therefore, point P is often called the assumed position (AP). To solve this you need the local hour angle (LHA) to the star’s subpoint and the star’s declination (dec). Using these, the Sight Reduction Tables give you the azimuth and the altitude of the star as seen from point P. From the azimuth you can calculate the true bearing toward the star’s subpoint. See the section “True bearing to a star”.
-
Draw a line from point P toward the star’s subpoint. The direction of this line is the true bearing computed in step 2.
- In step 2 we also obtained the star’s calculated altitude from point P. In addition, we measured the star’s altitude with a sextant. Now we can determine how much closer or farther we are from the star’s subpoint compared to point P. The distance difference equals the difference between the measured altitude and the calculated altitude at P, converted into nautical miles. See the section “Relation between angles, degrees, and nautical miles on Earth” on page 29. If the measured altitude is greater than the calculated altitude at P, then the true position is closer to the subpoint than point P. If it is smaller, then the true position is farther away.
-
Mark the distance difference between point P and the actual position along the bearing line through point P.
In the example, the measured altitude was smaller, so we are farther from the subpoint than point P.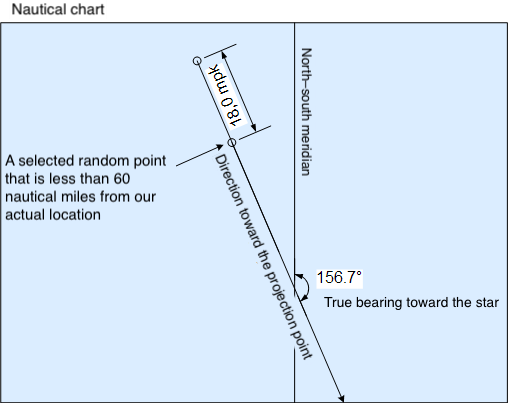
-
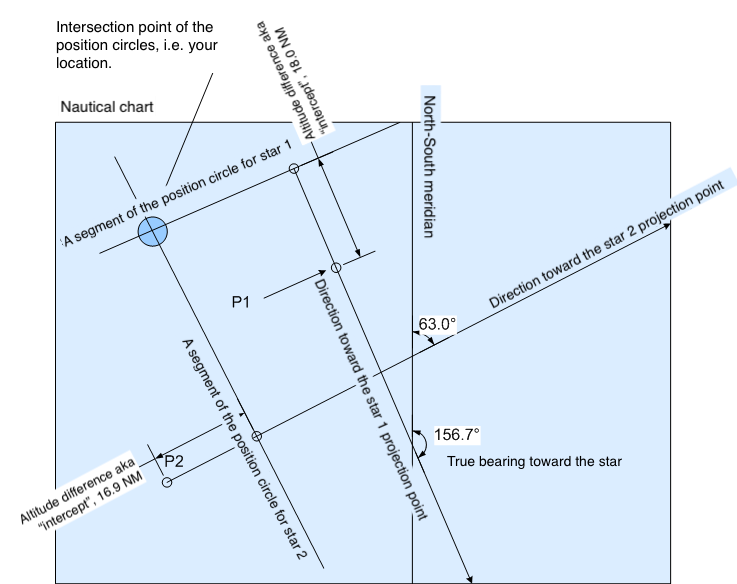
Now we have determined one point on the position circle and the direction toward the subpoint. The position circle is perpendicular to the direction toward the subpoint, so we can draw the arc of the position circle on the chart.
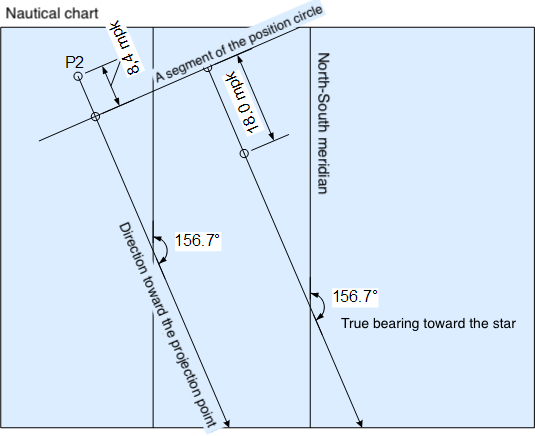
If we had chosen a different point P2 at the beginning, the result would still be the same. The calculated altitude of the star from P2 would be different, but the difference between calculated and measured altitude would still place the position circle in the same location. In the example below, the calculated altitude from point P2 is smaller than the measured altitude. Therefore, we know we are closer to the star’s subpoint than P2, and we can draw the perpendicular position circle segment closer to the subpoint by the altitude difference. The position circle thus ends in exactly the same place regardless of which arbitrary point we choose.
When we draw the bearing to a second star and its position circle segment on the same chart, we can determine our position. For this we can choose any suitable third point P3.
That’s it. This is how it works.
C o n t e n t s
- Position fixing from stars
- Night sky
- Celestial sphere
- What you see from the North Pole as Earth rotates
- How the night sky changes when traveling to the equator
- Effect of Earth’s rotation on the sky at the equator
- Celestial meridian, upper and lower culmination
- Change of star altitude at the poles, equator, and between
- Declination
- Example of determining latitude
- Hour angle, Greenwich Hour Angle (GHA)
- Aries, celestial Greenwich reference
- Sidereal hour angle (SHA)
- Local hour angle (LHA)
- Relation between hour angle and time
- Example of longitude and latitude from the Sun at noon
- Relation between angles, degrees, and nautical miles on Earth
- Position circle
- Azimuth
- True bearing to a star
- Nautical triangle
- Solving the nautical triangle (sight reduction)
- Position fixing using Marcq Saint Hilaire’s intercept method
- Star identification
- Details and practice
- Time
- Time difference (ΔT)
- Altitude measurement
- Example of position fixing
- Twilight
- Calculation of twilight time
- Navigation exam
Hamburg VII 2026